Free
Start for free
$0
- Up to 3 projects
- Up to 5 users on your team
Plan your program, measure what matters, share your outcomes and raise the funds to do more on b.world — built for nonprofits, foundations and social enterprises.
 the UN Sustainable Development Goals
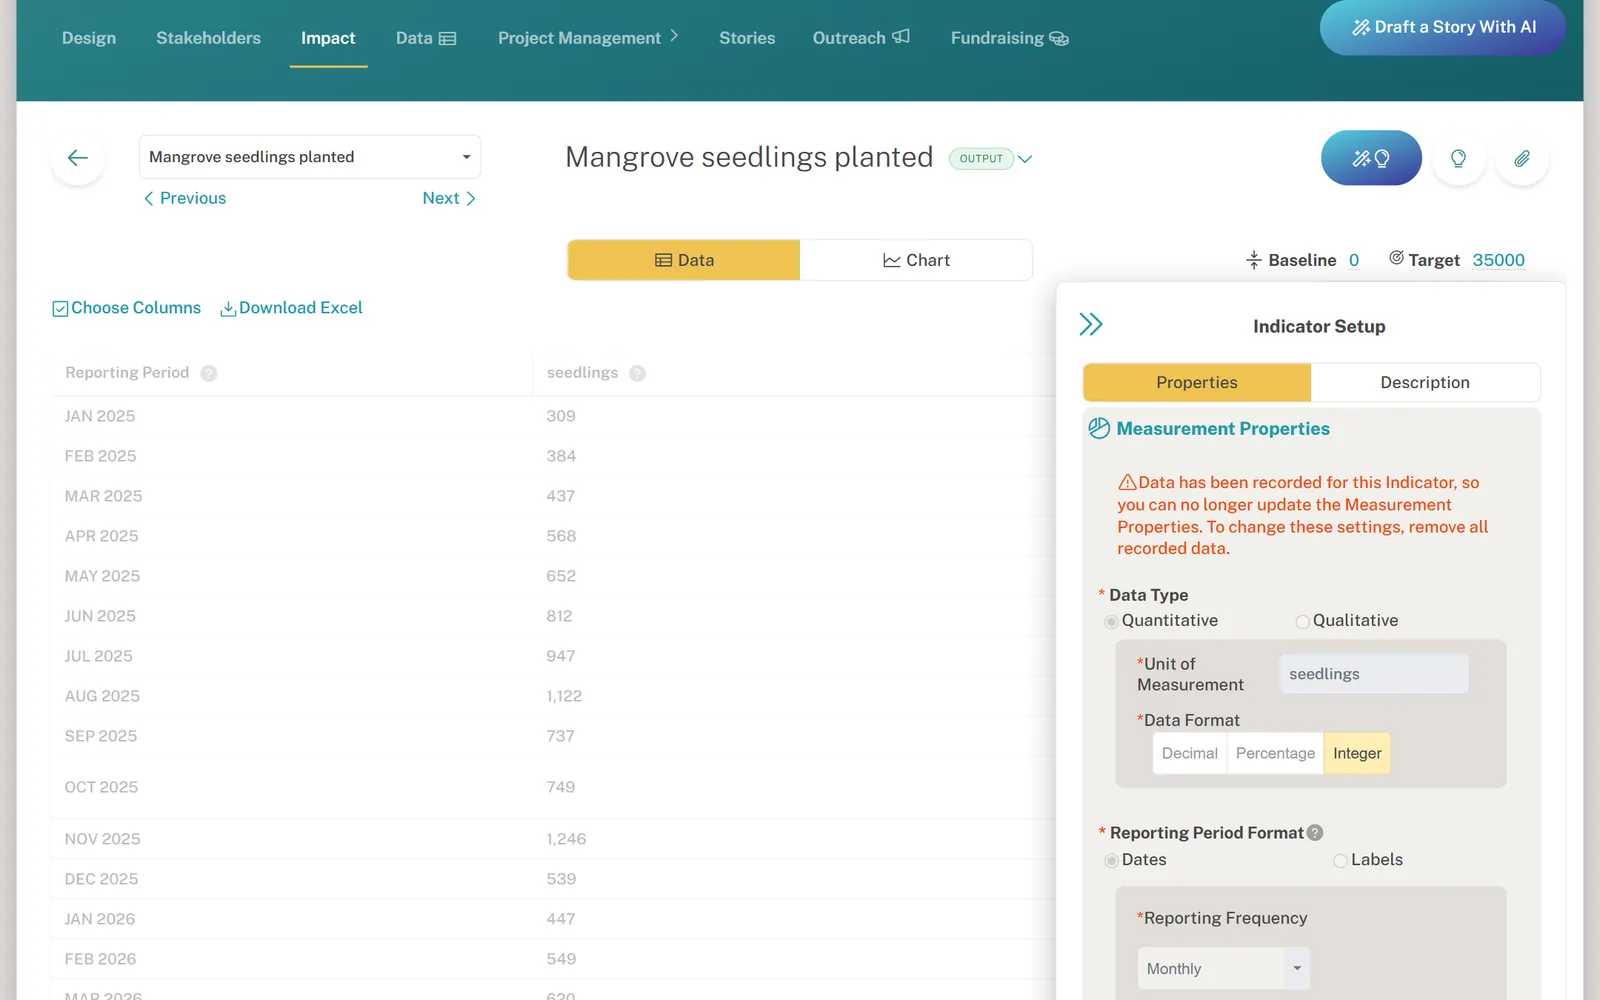
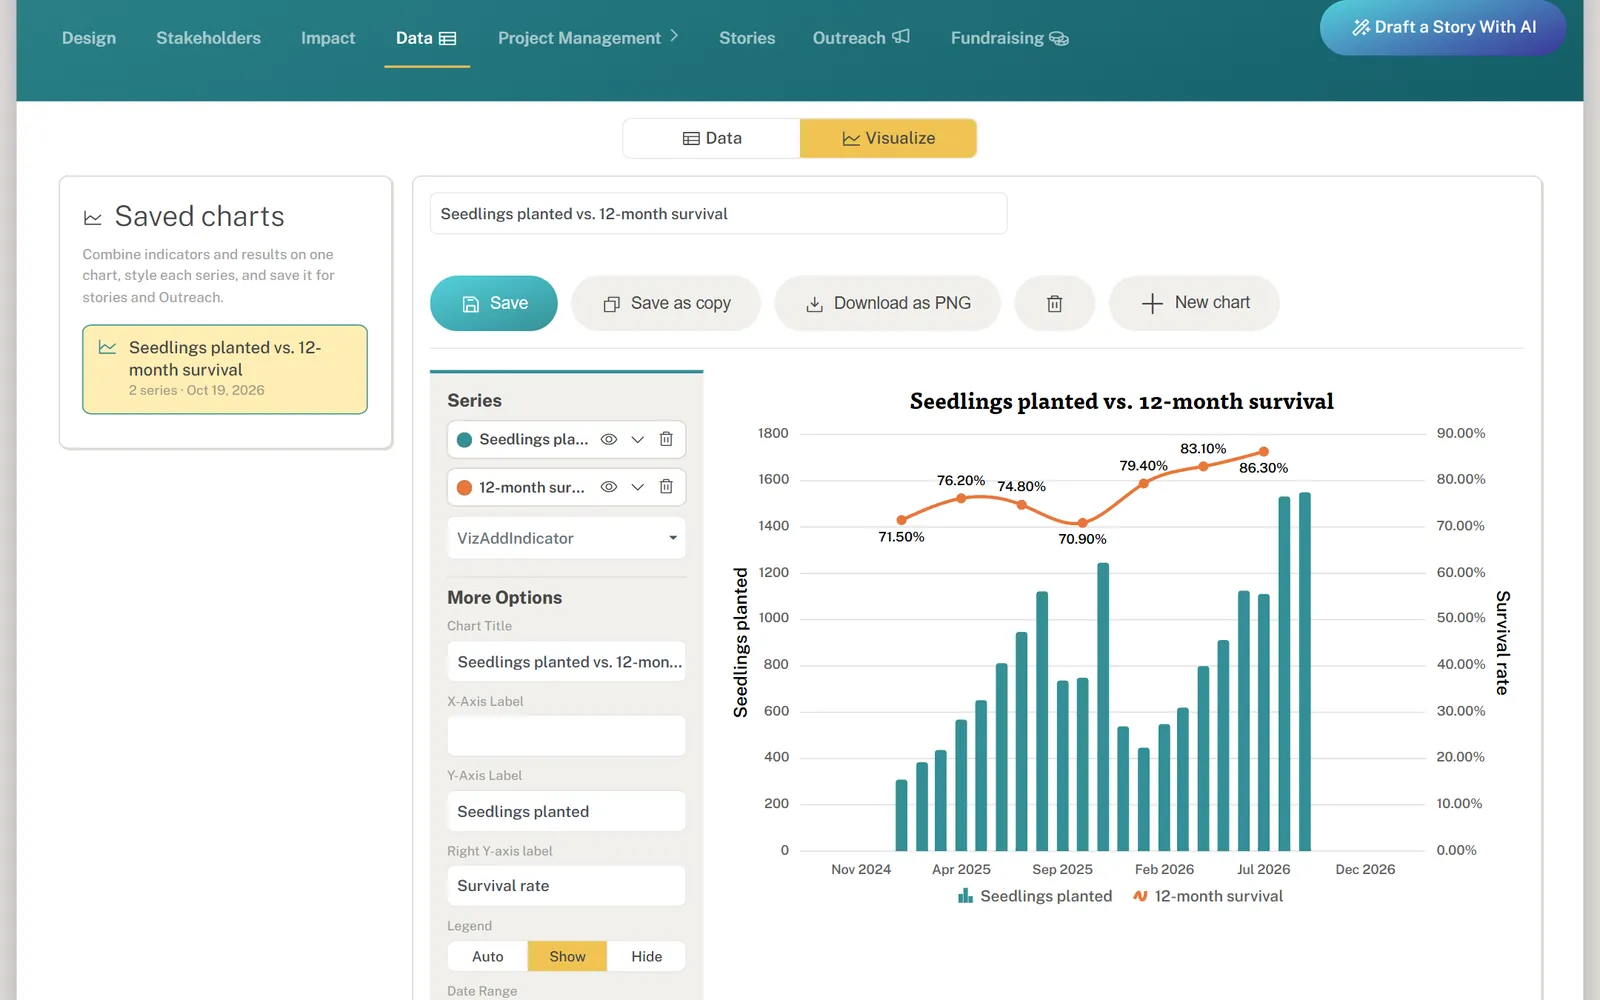
01Measurement
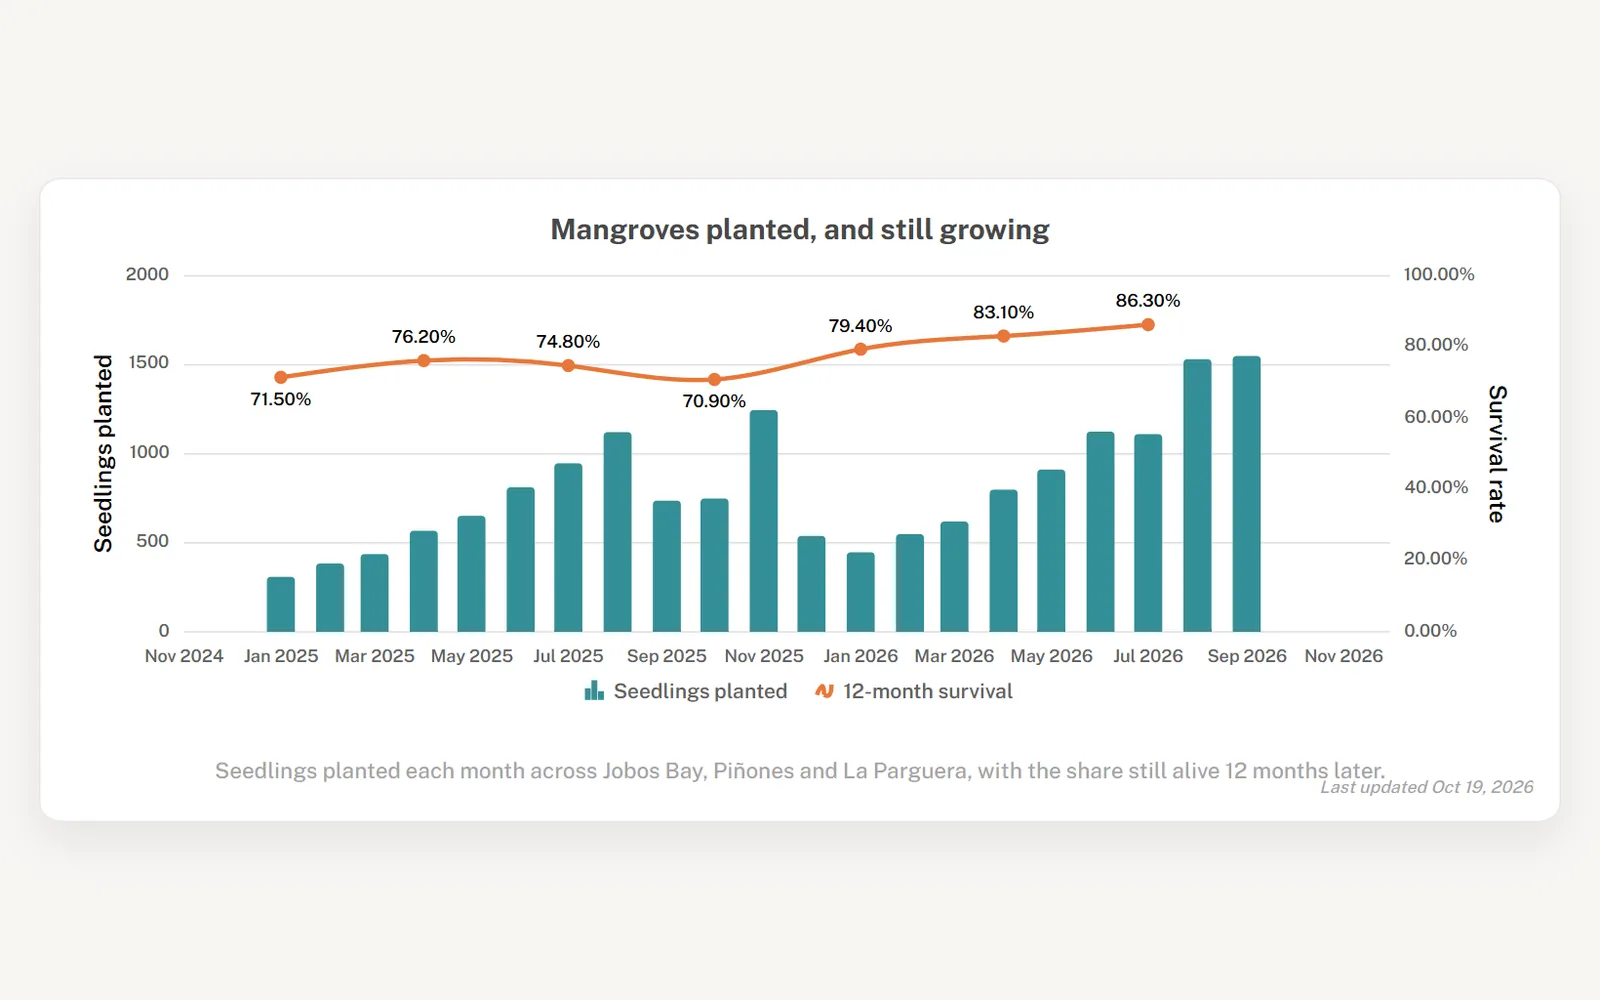
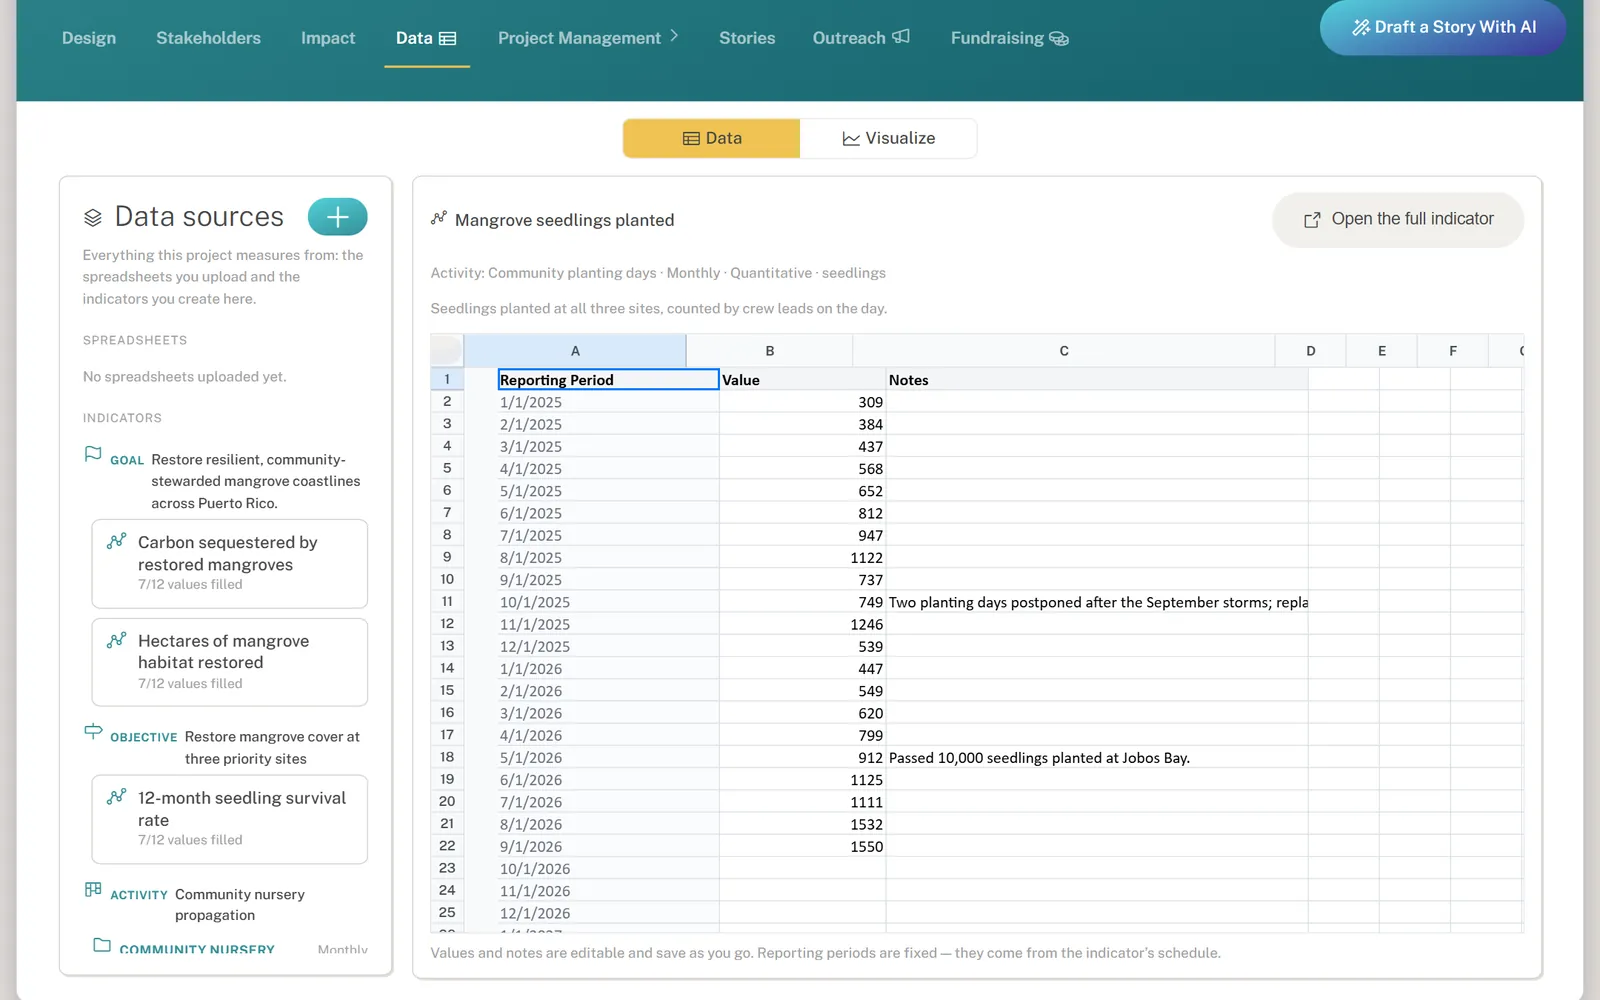
Bring your past data, capture new data easily, and visualize your impact with a click. Track indicators against IRIS+ and the United Nations Sustainable Development Goals.
02Outreach
Share data and stories with your community in real time with custom public pages and project-specific newsletters.
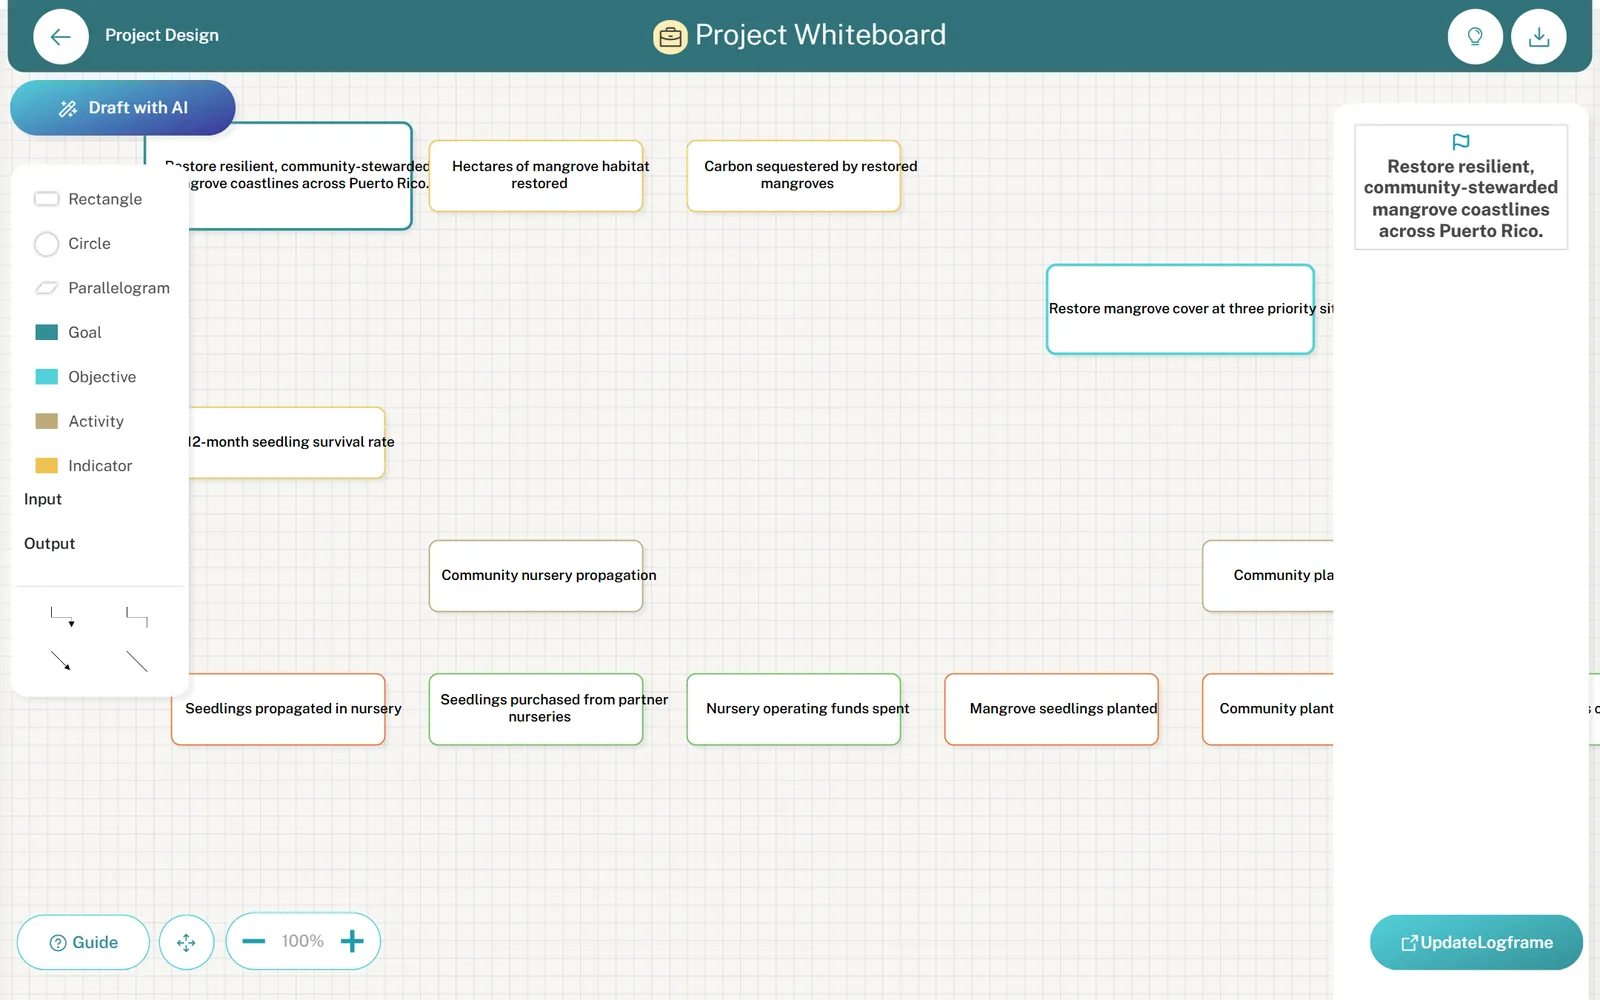
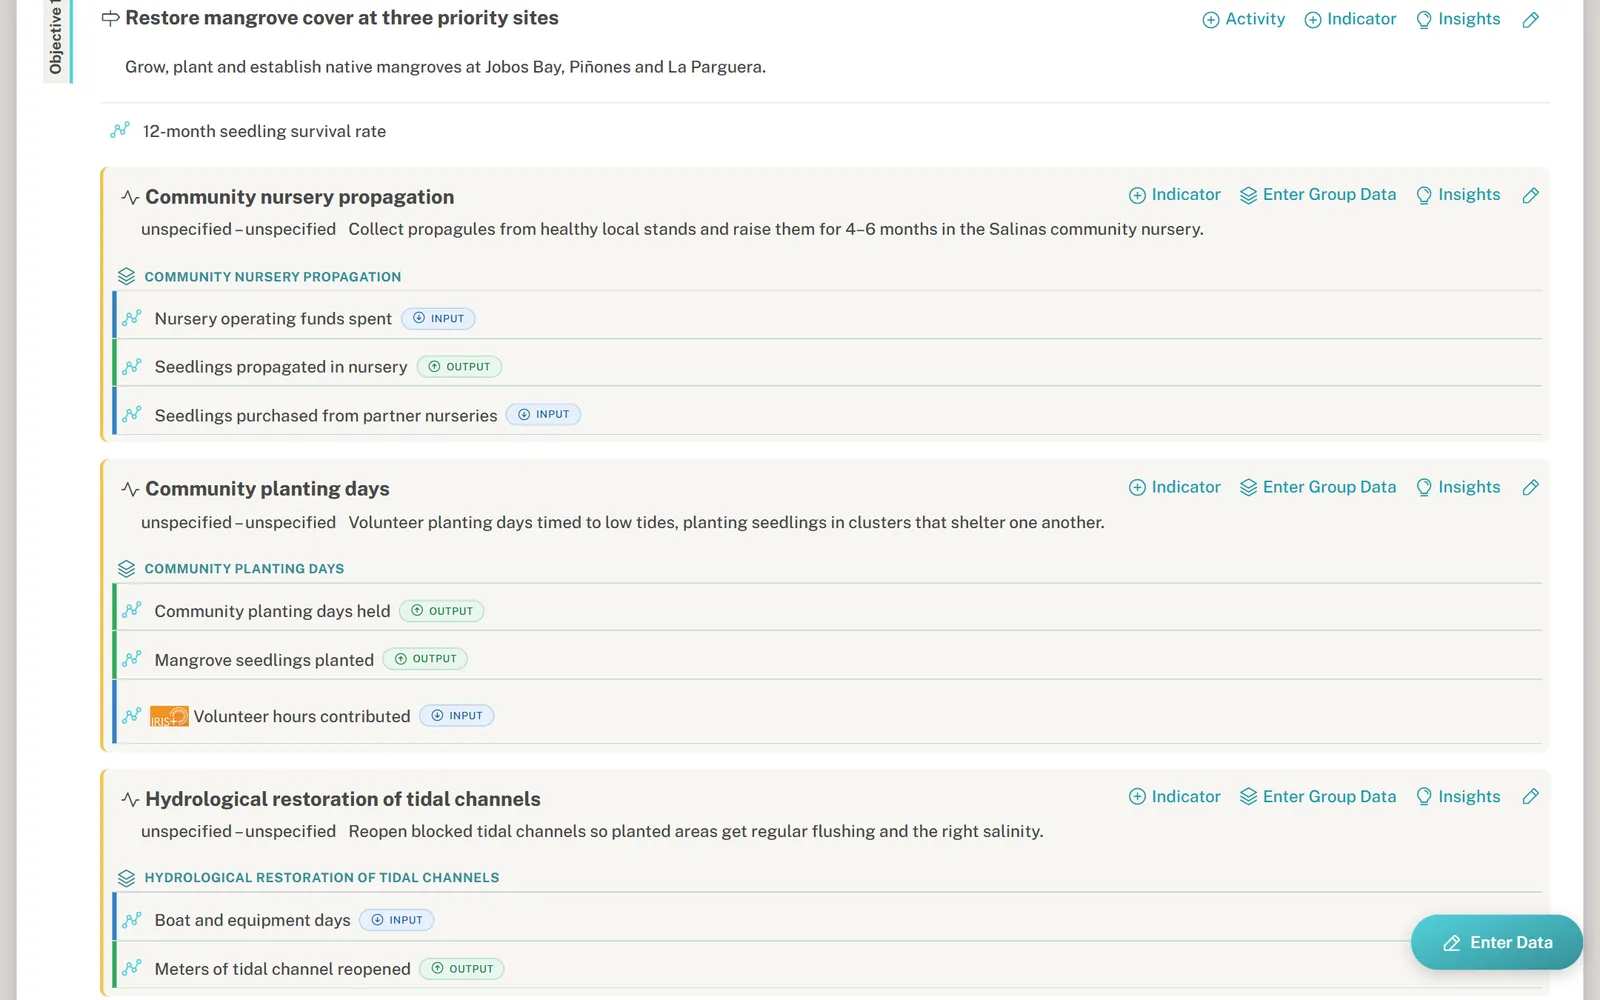
03Design
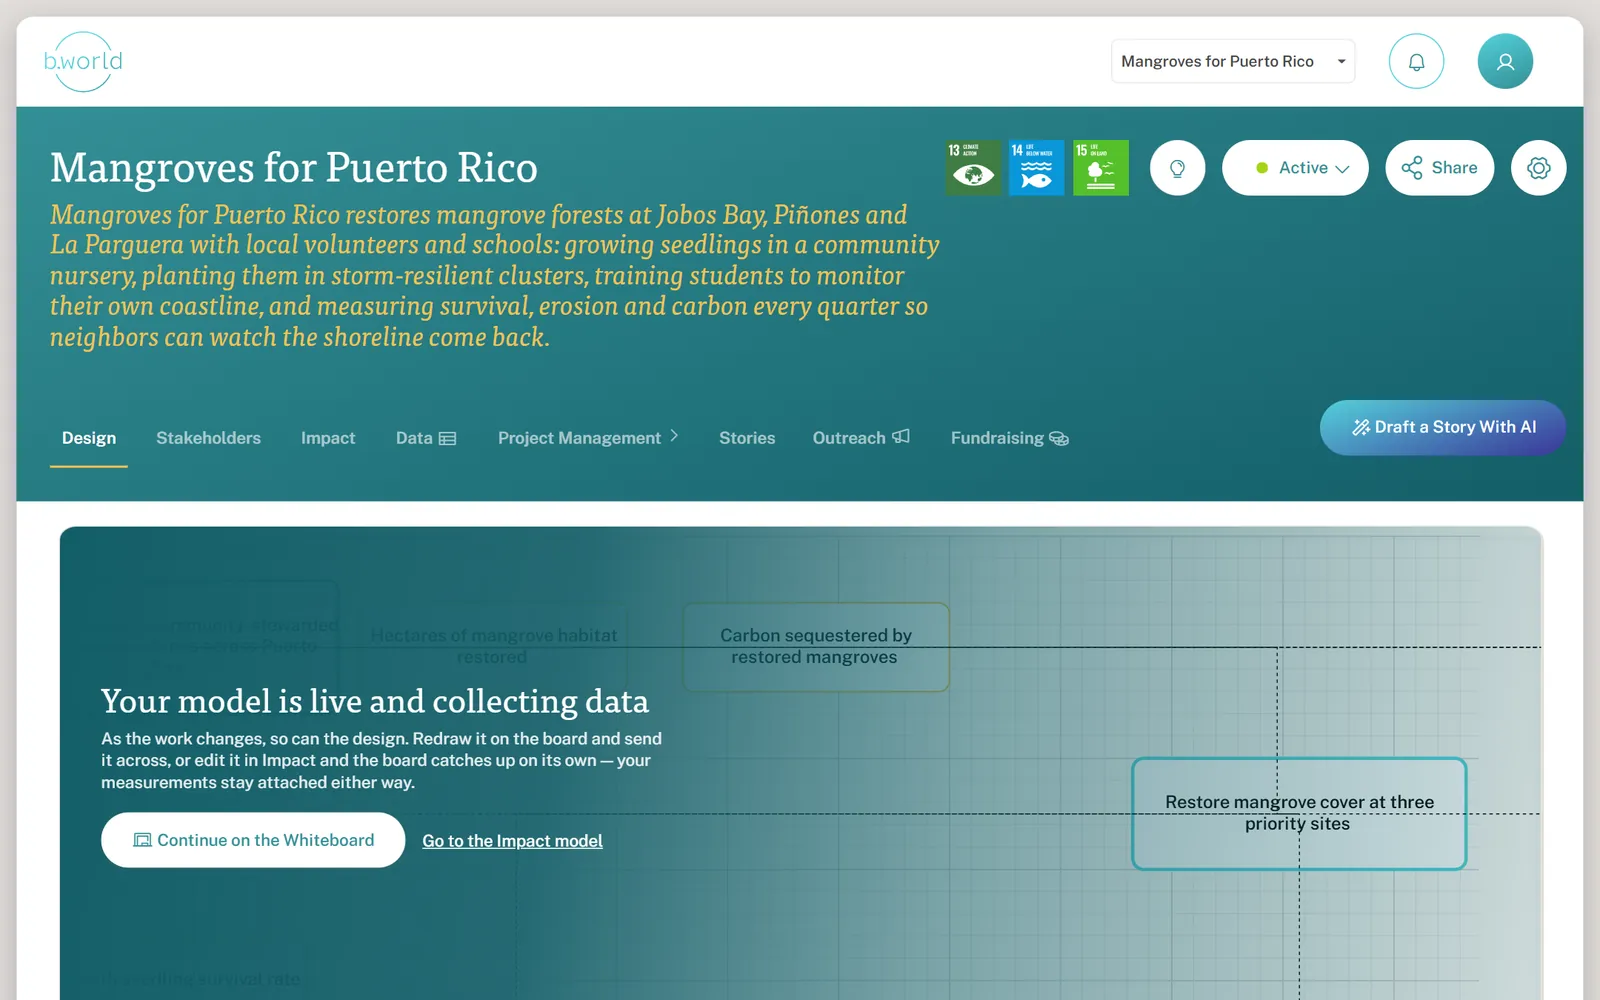
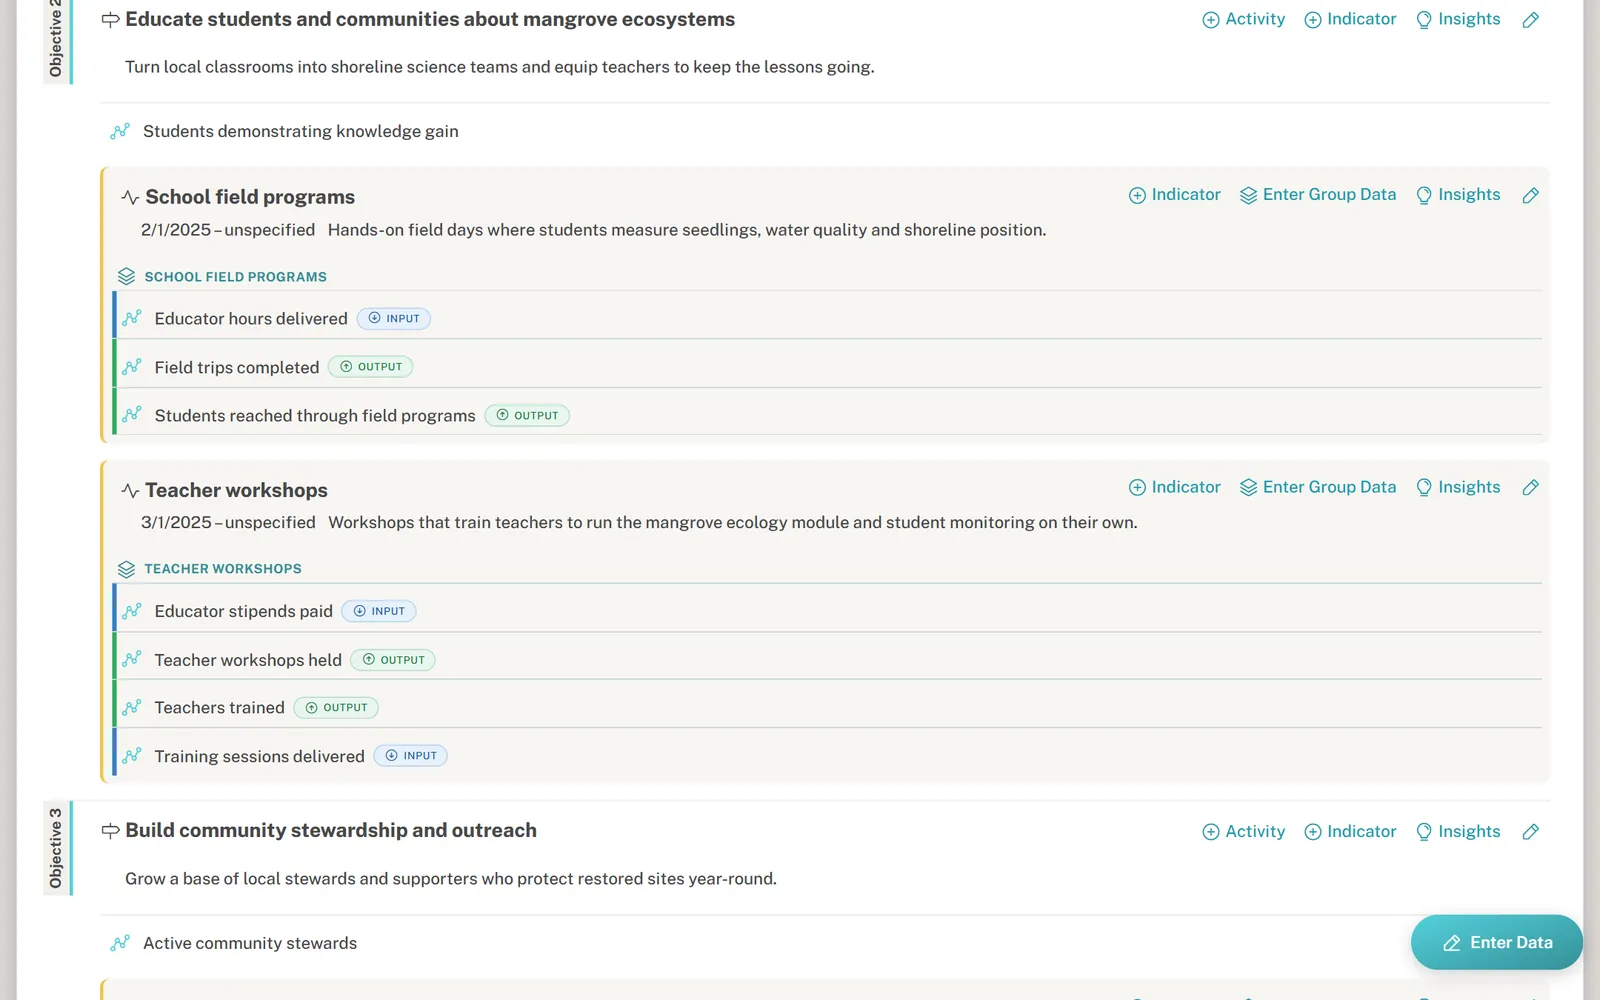
Visually design your logframe or impact model, assign tasks, manage inputs, outputs, stakeholders and budgets all in one platform.
04Fundraising
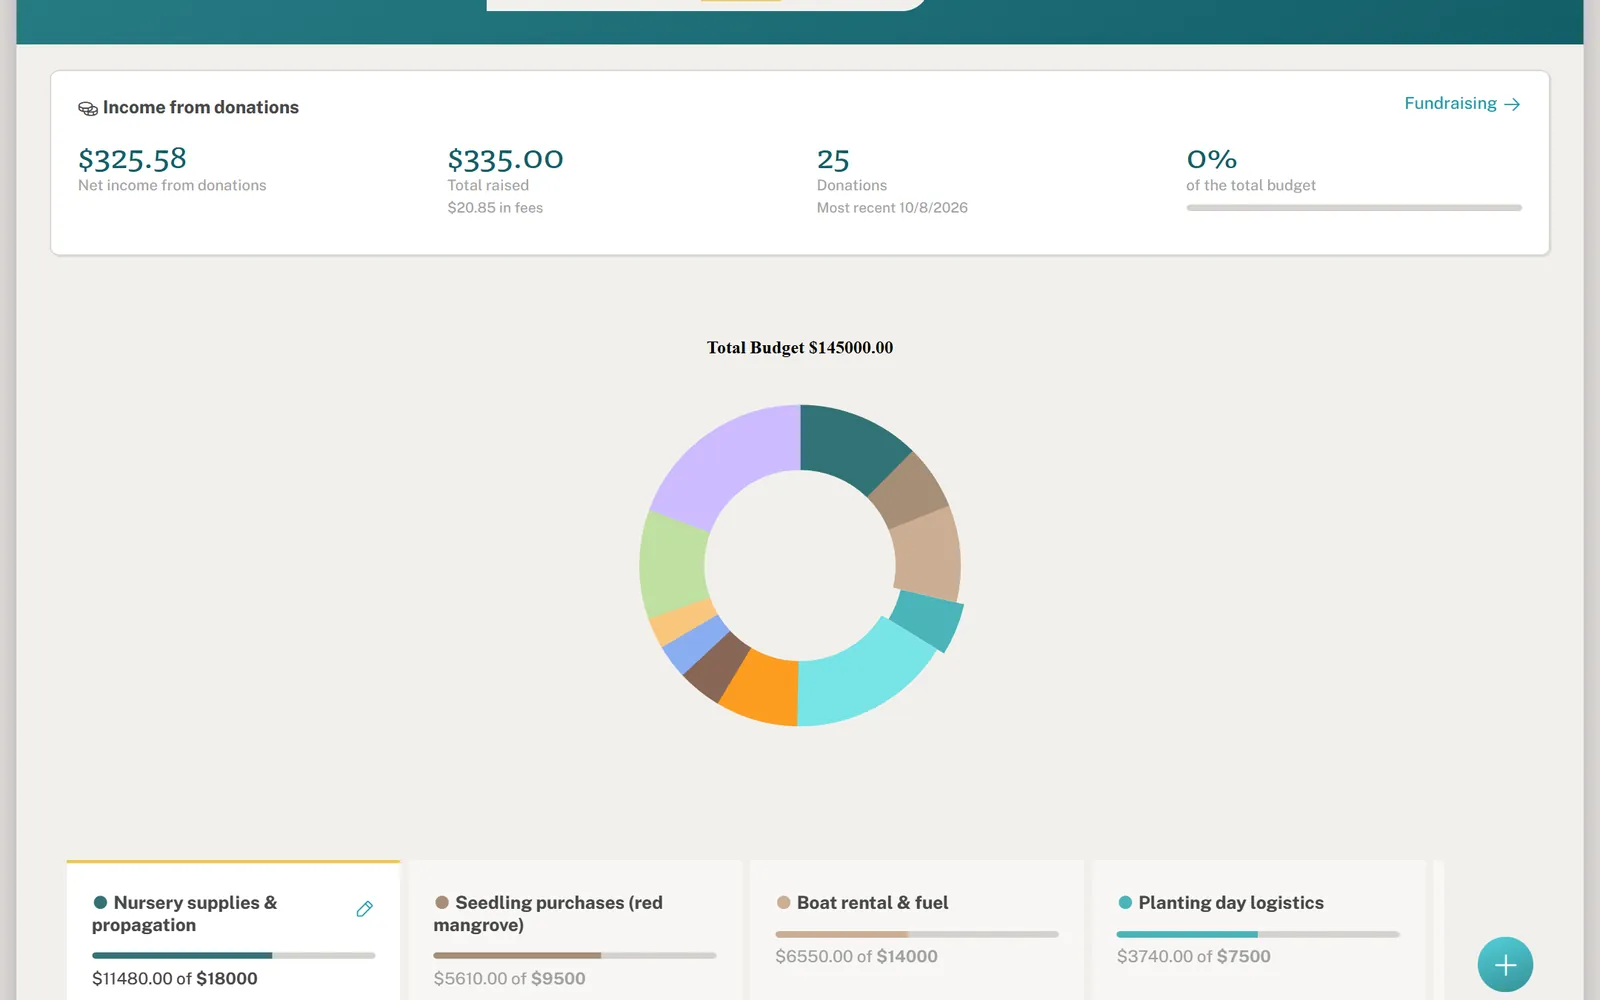
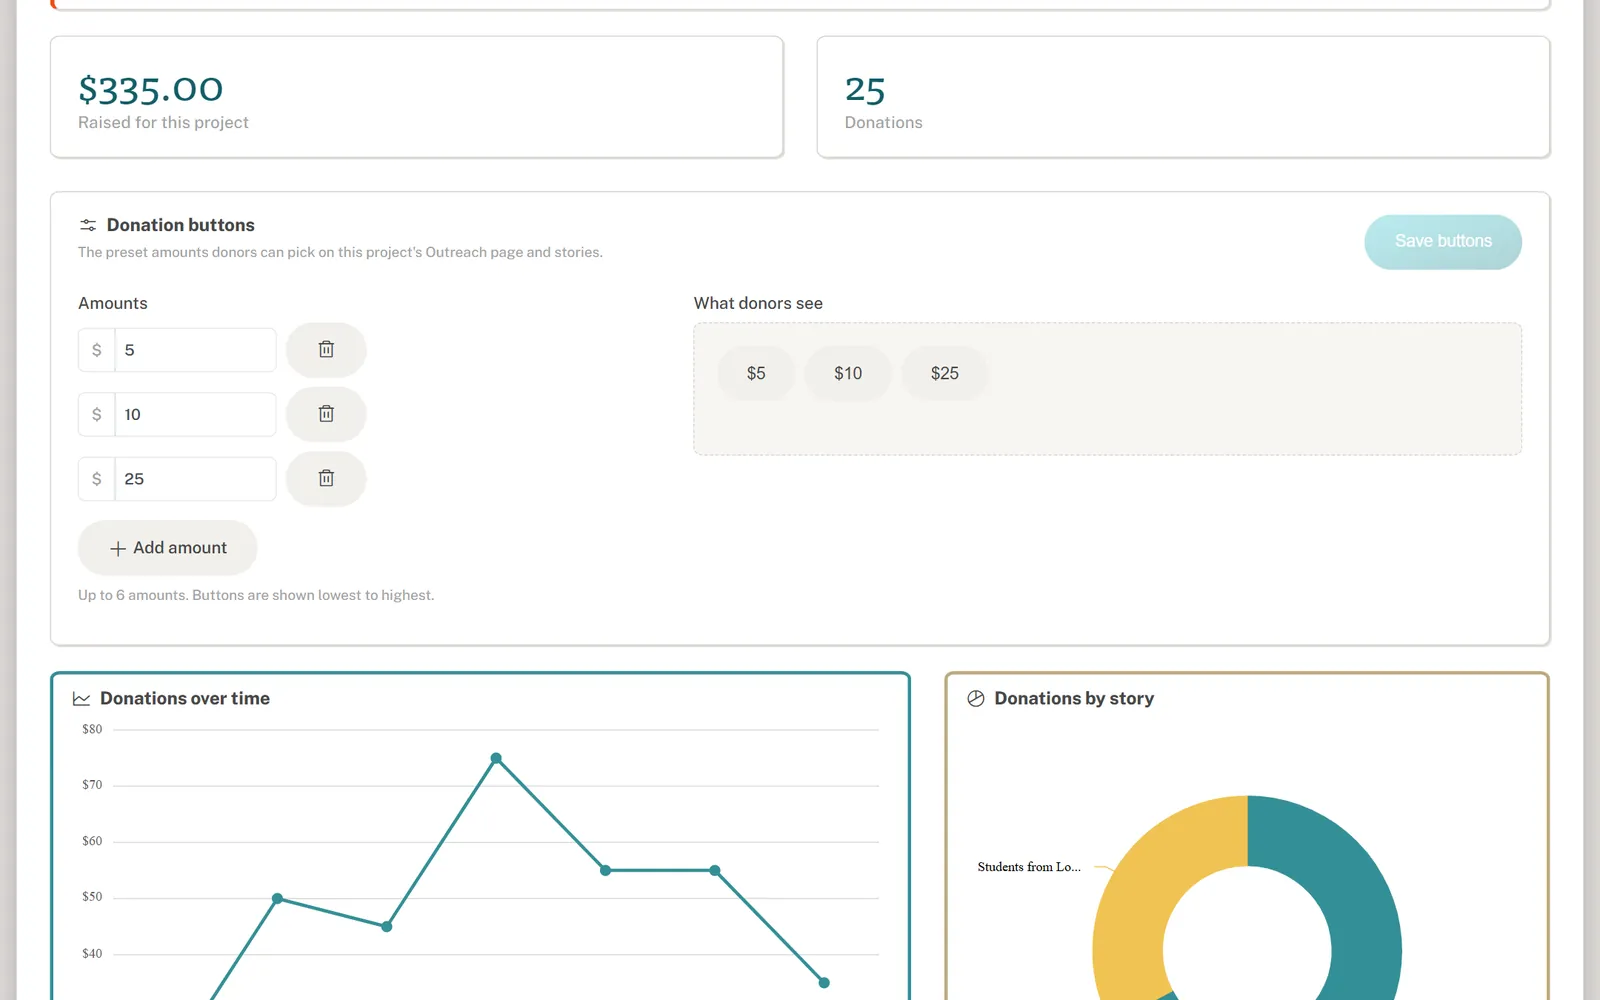
Put a donate button where your impact already lives — on your outreach page and inside every story. Supporters give in a couple of taps; b.world collects every gift, emails the receipt, and pays your balance out to your bank — with each donation tracked against the project and the story that inspired it.
In their words
b.world addresses pain points commonly expressed by complex nonprofits: to create a platform that raises awareness and accessibility of quantitative results joined with compelling stories, and makes it accessible to program designers, field workers, fundraisers and supporters alike while fostering collaboration amongst them.
 Alan LevinePrincipal, Barker & Scott Consulting
b.world is on the cutting edge of technology and their application of AI on their platform is going to help project managers and reporting officers across organisations communicate their work better.
 Roderick BesselingSocial Impact Data & Analytics Expert
b.world is super user-friendly which made it easy for me to find value in it right away. The way it combines data functionality with storytelling has been helpful to better understand my own work as well as communicate the results and impact.
 Mercedes FogarassySocial Impact Program Design & Data Expert
05Pricing
Start free with up to three projects. When your work outgrows them, unlock unlimited projects for a simple price per person.
Start for free
$0
For teams of up to 10
$10$100 per user / monthper user / year
Teams of 6–10: $8 per user / month Teams of 6–10: $90 per user / year
$50 per month
More than ten users?
Let’s talk
Prices in US dollars. Teams of 6–10 pay the lower rate for every user.
Set up your first project in minutes — describe it, upload a proposal, or start from a spreadsheet.
Impact measurement software helps nonprofits, foundations and social enterprises plan the change they want to create, track indicators over time, and report results to funders and communities. b.world brings logframes, data collection, charts, stories and fundraising together in one platform.
Yes. Indicators can be aligned to the IRIS+ catalog and to the UN Sustainable Development Goals, so the data you collect speaks the same language as your funders and impact investors.
Yes. Upload a spreadsheet of past results and b.world maps it to indicators, so your history and your new data live on the same charts.
A logframe, or logical framework, links your goal to objectives, activities and the indicators that prove progress. Draw one on the b.world whiteboard or let AI draft it from a short description. Prefer something lighter? Simple projects track just activities, inputs and outputs.
b.world collects every donation on your organization's behalf and distributes your balance to your bank when you withdraw, so there is no payment account to set up. Supporters give $5, $10 or $25 by card, Apple Pay or Google Pay from your outreach page or your stories; every donor is emailed a receipt and every gift is recorded against the project and story that inspired it. Fundraising is currently available to US-based organizations with an EIN.
b.world is free for up to three projects and up to five users. Unlimited projects cost $10 per user per month or $100 per user per year for teams of up to five, and $8 per user per month or $90 per user per year for teams of six to ten. Teams of more than ten can contact us for enterprise pricing.
Nonprofits, NGOs, foundations, social enterprises and CSR teams of any size that want to measure, manage and communicate their impact without hiring a data team. The platform is available in English, Spanish and French.